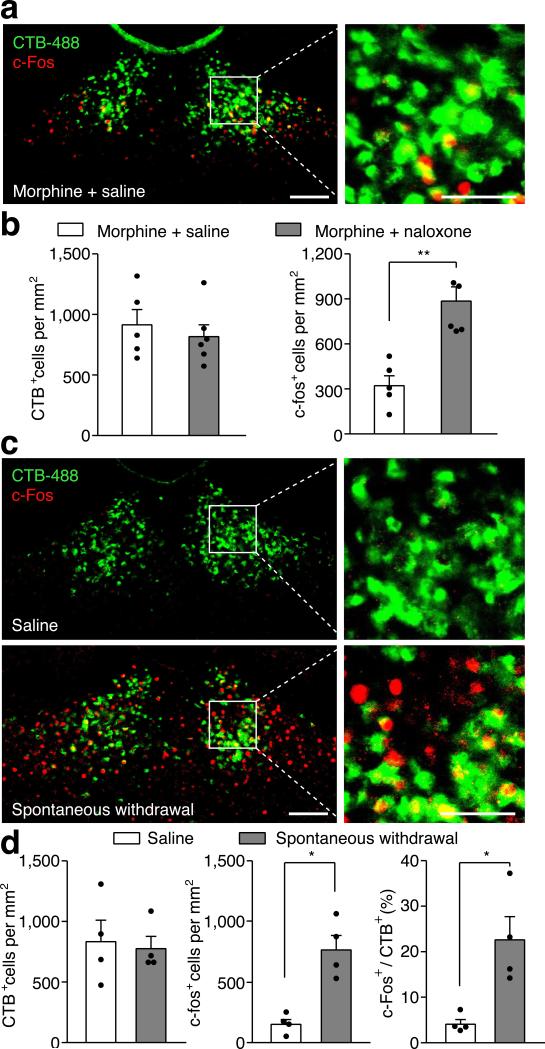
Extended Data Figure 6. Opiate withdrawal induced c-Fos expression in the PVTNAc projection neurons.
a, Example confocal image shows expression of c-Fos in a small number of PVTNAc projection neurons after injection of saline into chronic morphine treated mice. Left: scale bar, 100 μm; Right: magnified image shows the boxed area. Scale bar, 50 μm. b, Quantification of CTB (left) and c-fos (right) positive cells per mm2 after injection of saline (white bar, n = 5) or naloxone (gray bar, n = 6) into chronic morphine treated mice. c, Example confocal images show that spontaneous withdrawal from morphine (lower panel) but not saline (upper panel) treatment increases the expression of c-Fos in PVTNAc projection neurons. Left: scale bar, 100 μm; Right: magnified image shows the boxed area. Scale bar, 50 μm. d, Quantification of CTB (left) and c-fos (middle) positive cells per mm2 and percentage of PVTNAc projection neurons (right) that express c-Fos induced by spontaneous withdrawal from morphine (gray bar, n = 4) or saline (white bar, n = 4). Mann–Whitney U-test, *p < 0.05, **p < 0.01. Mean ± s.e.m.

