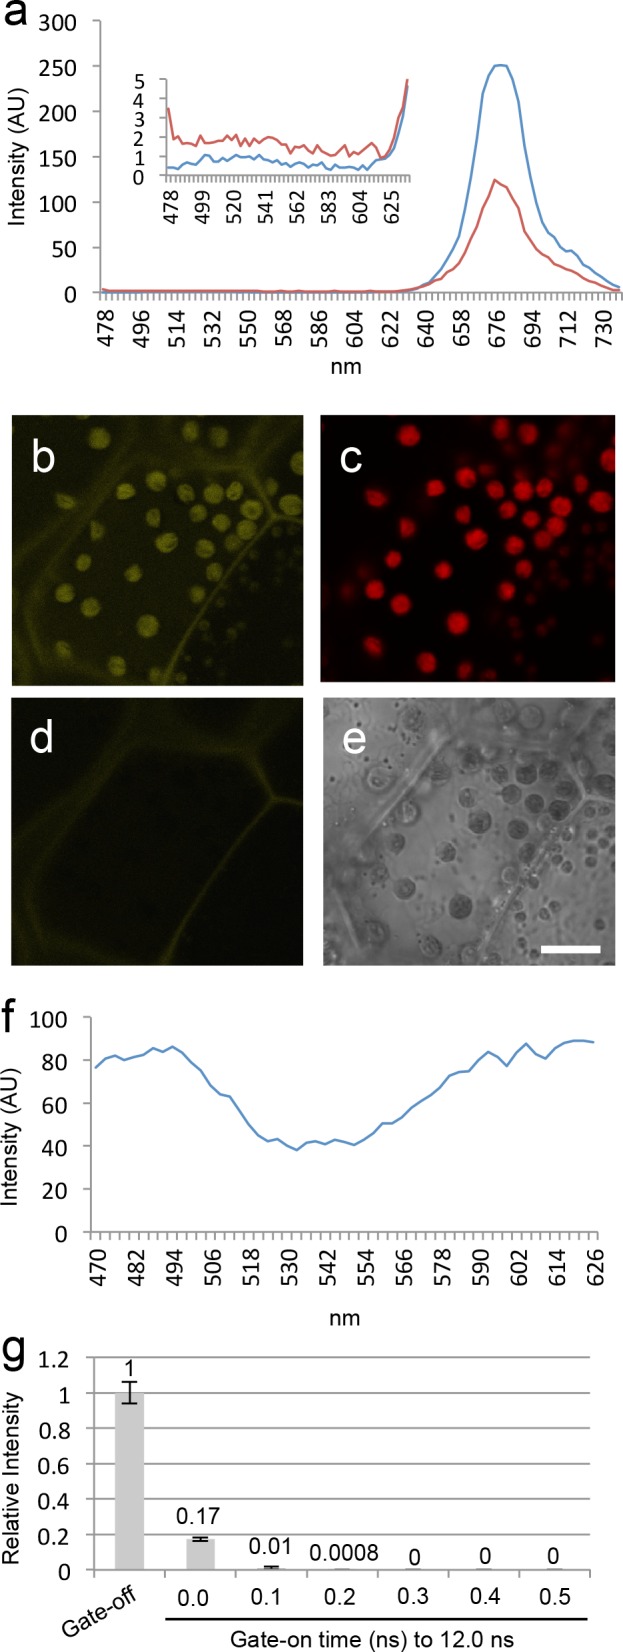
Fig 1. Chloroplast autofluorescence and time-gated rejection in Marchantia polymorpha.

Chloroplast autofluorescence (a) emission spectra from unbleached (blue) and bleached (red) chloroplasts. Light intensities as arbitrary unit (AU). (b-d) Representative images at the yellow wavelength region (520–561 nm) (b), at the red wavelength region (648–709 nm) (c), and at the yellow wavelength region (520–561 nm) with time gating (gate-on time: 0.3–12.0 ns) (d). (e) Bright field image. Scale bar, 10 μm. (f) Excitation spectrum of chloroplast autofluorescence. (g) Effects of time-gated fluorescence imaging technique at the yellow wavelength region. Relative light intensities are shown. Experiments were performed thrice (with three different samples); bars represent standard deviations. The averaged number is shown at the each graph.
