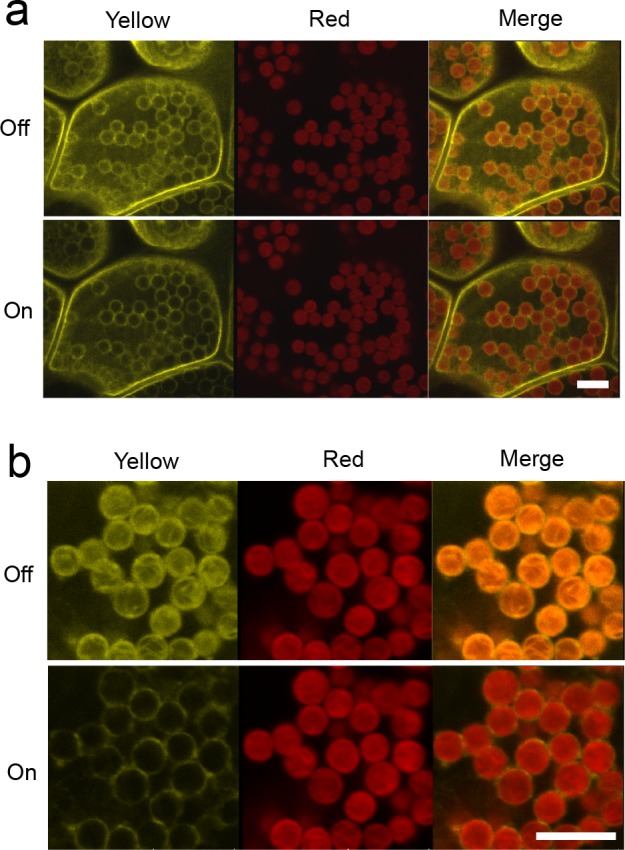
Fig 2. Fluorescence imaging of Mpphot-Citrine on the chloroplast periphery of transgenic Marchantia polymorpha.

(a) Single cellular fluorescence imaging. (b) Intracellular fluorescence imaging. Upper and lower panels reveal gate-off and gate-on (time: 0.3–12.0 ns) images, respectively. Left and center panels show images at the yellow (520–561 nm) and red (648–709 nm) wavelength regions, respectively. The right panels demonstrate merged images comprising yellow and red images. Scale bar, 10 μm.
