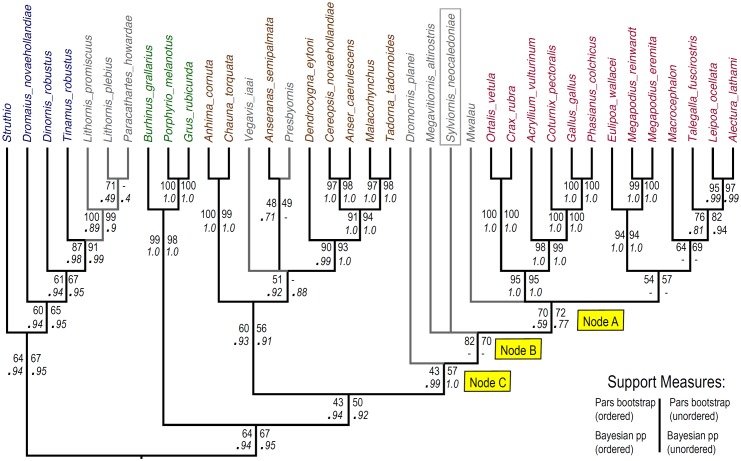
Fig 13. The strict consensus tree from parsimony and ordered analysis with a molecular backbone constraint.
In this analysis, relationships between taxa with molecular data (living taxa and moa) were constrained, with other (fossil) taxa free to move to their optimal positions within this backbone. Tree statistics: Length 1425, Consistency index = 0.2786, Homoplasy index = 0.7214, Retention index = 0.6295. The Bootstrap and probability values of the other analyses (Parsimony, unordered, Bayesian ordered and unordered) are shown, with a dash to indicate clade not found.

