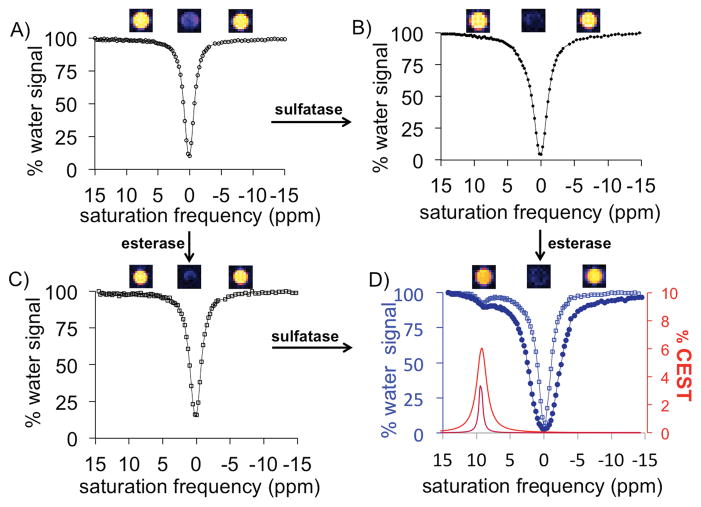
Figure 3.
CEST MRI studies of serial enzyme treatments. A) The agent 4 with two protecting groups showed no CEST signal before treatment with enzymes, and only the decrease in water signal from saturation at the MR frequency of water (0 ppm) was observed. After treatment with B) sulfatase enzyme or C) esterase enzyme, the CEST agent had only one protecting group yet still could not generate a CEST signal. D) Treatment with the second enzyme produced the salicylic acid product that generated a CEST signal at 9.25 ppm. The spectra of the reaction derived from panel B is shown as dark blue, closed circles and a dark red Lorentzian line shape, and the spectra of the reaction derived from panel C is shown as light blue, open squares and a light red Lorentzian line shape. MR images are shown above each CEST spectrum.

