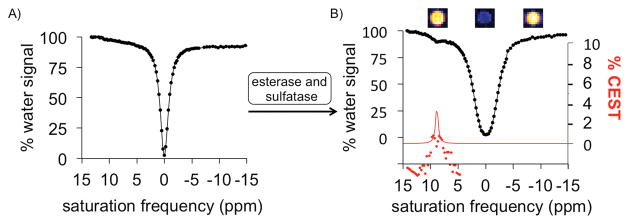
Figure 4.
CEST MRI studies of simultaneous enzyme treatment. Simultaneous treatment with esterase and sulfatase enzymes converted A) the agent 4 that generated no CEST signal, B) to salicylic acid generated a CEST signal at 9.25 ppm. MR images are shown above CEST spectrum of the product. The red line represents the Lorentzian line shape of the CEST signal and the red circles represent the residuals of the fitting. The residuals are negligible around the center of the CEST signal, showing that Lorentzian line shape fitting is accurate for estimating CEST signal amplitude. The significant residuals around the “wings” of the Lorentzian line shape indicate that the CEST signal is not a true Lorentzian line shape, which agrees with a previous report.[20]

