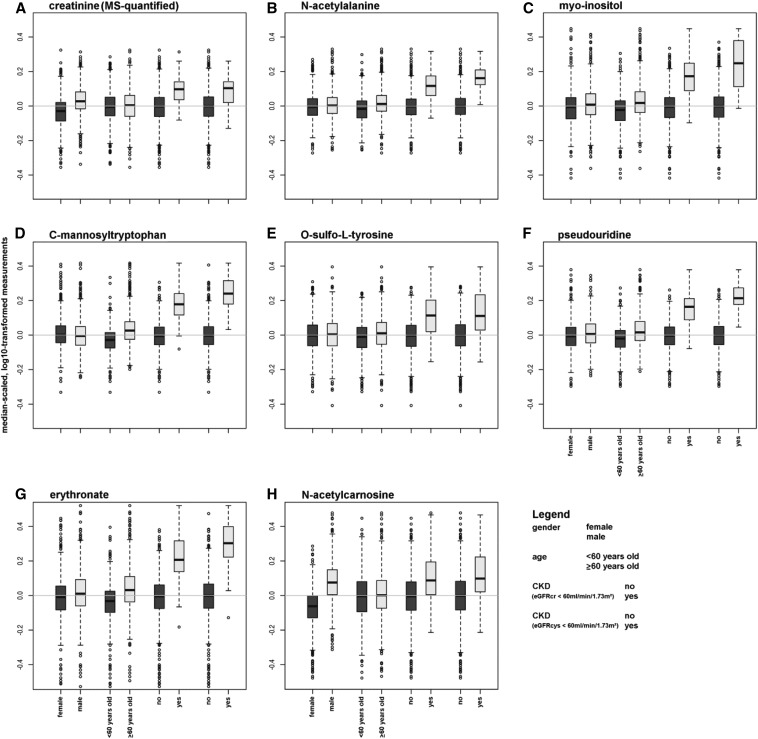
Figure 1.
Distribution of eGFR-associated markers across strata of CKD and its major risk factors. (A) Creatinine (MS-quantified). (B) N-acetylalanine. (C) Myo-inositol. (D) C-mannosyltryptophan. (E) O-sulfo-L-tyrosine. (F) Pseudouridine. (G) Erythronate. (H) N-acetylcarnosine. The two box plots on the right of each panel represent strata of cystatin-C based CKD and show that especially concentrations of erythronate, pseudouridine, and C-mannosyltryptophan differ more strongly by CKD status than does serum creatinine. Differences in the dependencies on sex and age can be observed for different metabolites.

