Figure 3.
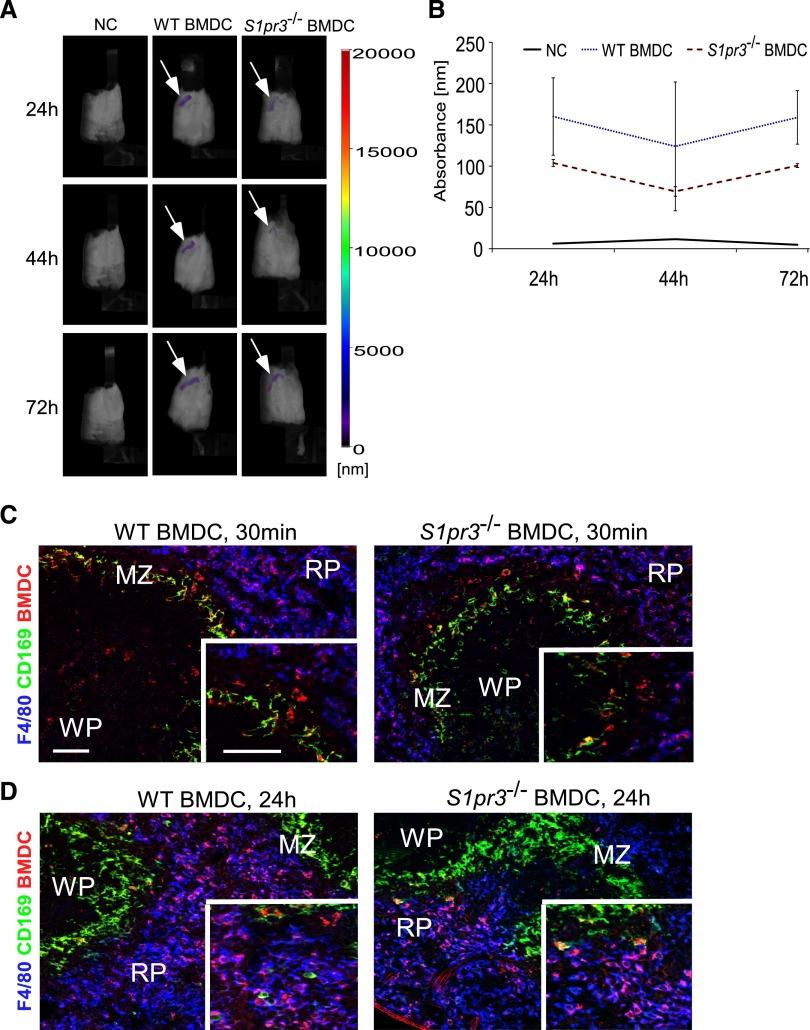
Labeled WT or S1pr3−/− BMDCs are detected in recipient spleen after adoptive transfer. (A) C57BL/6 WT mice were injected with VT-680–labeled WT and S1pr3−/− BMDCs, and in vivo imaging was performed 24, 44, and 72 hours after injection. The majority of the injected BMDCs went to the recipient spleen (white arrows), with little to no measureable signal found in lungs, liver, kidneys, or lymph nodes. Compared with no cells (NCs; mice injected with PBS), no obvious differences in BMDC intensity were observed in mice with WT or S1pr3−/− BMDCs. Fluorescent intensity is indicated by the color-coded bar. (B) Graph shows quantified differences in absorbance between NCs, WT BMDCs, and S1pr3−/− BMDCs in mice at 24, 44, and 72 hours after injection (n=3). (C and D) Injected BMDCs are phagocytized by F4/80 red pulp [RP] macrophages at 24 hours. Mice were injected with PKH26GL-labeled BMDCs from WT or S1pr3−/− mice. Spleens were harvested (C) 30 minutes or (D) 24 hours after BMDC injection, and sections were labeled with CD169 (clone MOMA-1; MZ macrophages) and F4/80 (RP macrophages). Red dye–labeled BMDCs and possibly free dye are shown in all panels. WP, white pulp. Scale bar, 100 μm.

