Figure 5.
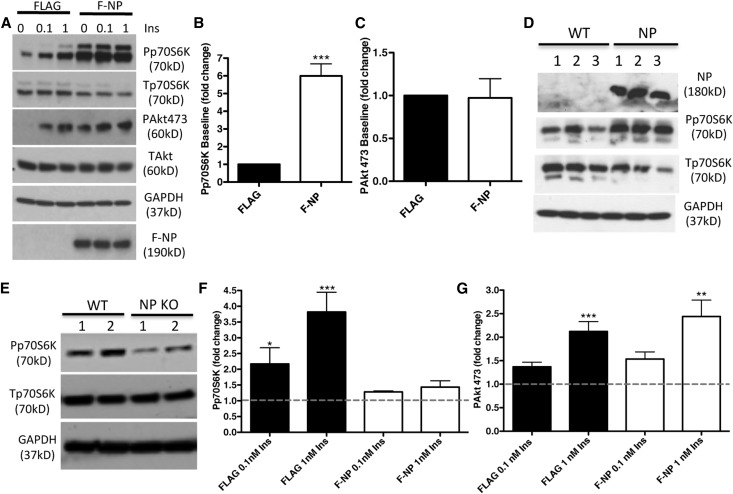
NP overexpression is sufficient to augment p70S6K phosphorylation. (A) Representative WB of lysates from F-NP– and FLAG–transfected HEK293 cells at baseline and after 20 minutes of insulin stimulation at indicated concentrations. Both phosphorylated (P) and total (T) Akt and p70S6K were studied. (B and C) Bar graph analyses of (B) Pp70S6K and (C) PAkt473 in F-NP–transfected cells compared with FLAG-transfected cells. (D) WB analysis of MIN6 cells transfected with an empty vector (wild-type [WT] clones 1–3) or NP (NP clones 1–3) showing increased phosphorylated p70S6K in NP cells compared with WT cells. (E) WB analysis of Pp70S6K and Tp70S6K performed in two different pools of islets (1 and 2; n=6 each) isolated from WT and NP knockout (KO) mice. (F and G) Bar graph analysis of (F) Pp70S6K and (G) PAkt473 in F-NP–transfected cells compared with FLAG-transfected cells exposed to exogenous insulin (0.1 and 1 nM Ins). Each value was corrected by the value of total protein (Akt or p70S6K) and GAPDH. Data represent means±SEM (n=3). Dotted lines represent baselines. *P<0.05; **P<0.01; ***P<0.001 compared insulin-treated with noninsulin controls.

