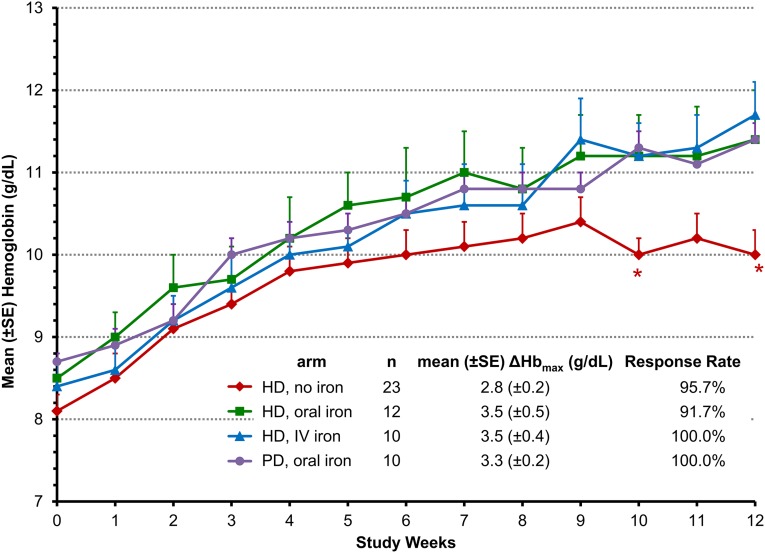
Figure 2.
Mean hemoglobin levels over time are similar through 7 weeks for all treatment groups and thereafter lower for the no-iron vs oral or IV iron groups. Data are for the EE population using last-observation-carried-forward imputation for missing data and are expressed as the mean±SEM Hb value at each time point. Week 0 (baseline) is the mean of three predosing Hb values. *P<0.05 in comparisons between no-iron cohort to the pooled iron cohorts based on the repeated-measures analysis of covariance model with baseline Hb and iron repletion status as covariates, using all observed data collected during treatment.

