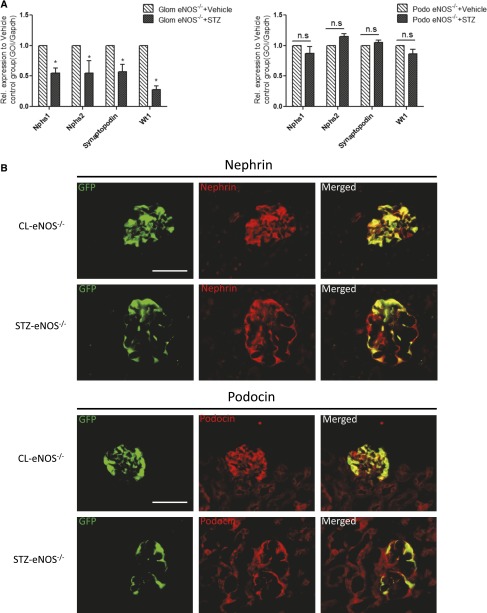
Figure 2.
qPCR analysis and immunostaining of podocyte marker between diabetic and control mice. (A) qPCR was performed for podocyte-specific genes, Neph1, Neph2, synaptopodin, and WT-1, in isolated glomeruli and sorted podocytes from both diabetic and non-diabetic mice. (*P<0.05 compared with citrate-treated control glomeruli, n=3; GOI, gene of interest). (B) Immunostaining of podocyte markers was performed in the kidney of these mice. EGFP was visualized in the podocytes of both STZ-eNOS−/− and CL-eNOS−/−mice. Immunofluorescence staining was performed for nephrin (top panel) and podocin (bottom panel) in the kidney of these mice. The representative images taken from in each group are shown (n=3, original magnification ×400, bar=50 μm).

