
Figure 5.
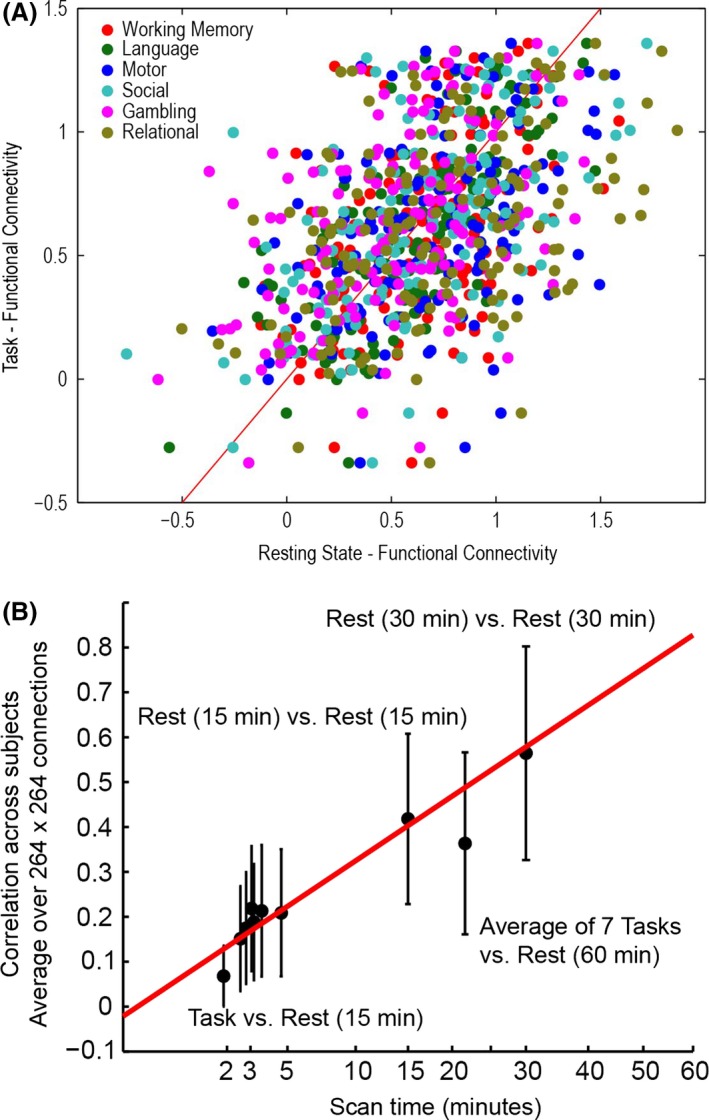
Preservation of individual differences in connectivity at task and rest. (A) One representative connection (left ACC to left anterior insula) showing for 476 subjects comparison of functional connectivity acquired during 6 tasks (1 acquisition) versus rest (60 min). (B) For each connection, the correlation across 476 subjects was computed for 264 × 264 ROIs. Error bars show standard deviation across connections. Correlation across subjects improves with the square root of imaging time of the shortest sequence.