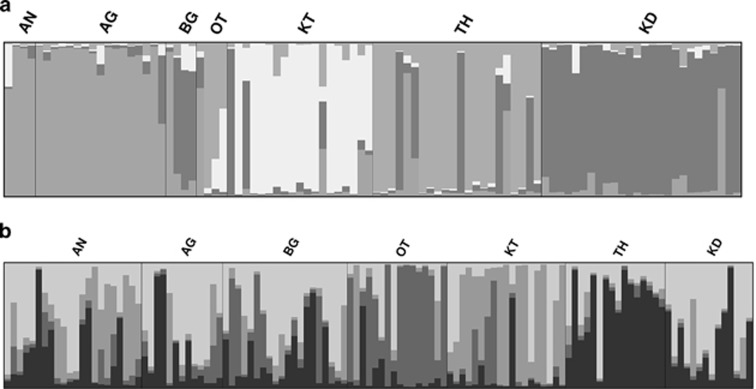
Figure 3.
Genetic cluster analyses of the data sets with microsatellite loci for both species. Each vertical bar represents a single individual and colour of the individual represents membership coefficient of the individual for a cluster. (a) Histogram of individual membership coefficients in R. satarae for K=4 (ΔK=107.4 ). (b) Histogram of individual membership coefficients in R. rattus for K=4 (ΔK=51.107). The full colour version of this figure is available at the Heredity online.

