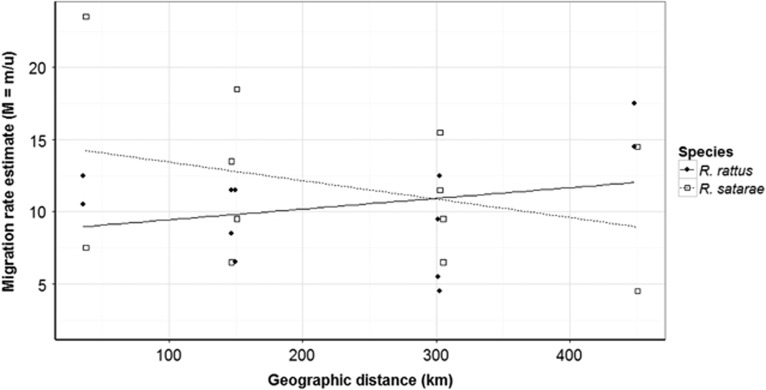
Figure 5.
Estimation of asymmetric migration rates for four populations. Comparing migration rates with distance (in km) between source populations for R. rattus and R. satarae (closed circles, solid line: R. rattus, open squares, dotted line: R. satarae). Modes of posterior distribution of migration rates were used to construct this plot.

