
Figure 4.
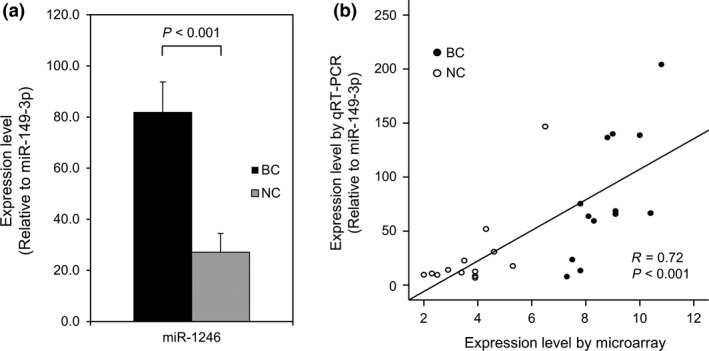
Expression levels of serum miR‐1246 using quantitative RT‐PCR (qRT‐PCR). (a) The expression levels of miR‐1246 are significantly upregulated in the serum of cancer patients. The expression levels were normalized to miR‐149‐3p. The error bars indicate the standard error. (b) The expression levels of miR‐1246 examined by qRT‐PCR significantly correlated with those obtained by microarray analysis. BC, patients with breast cancer (n = 13); NC, non‐cancer controls (n = 13).