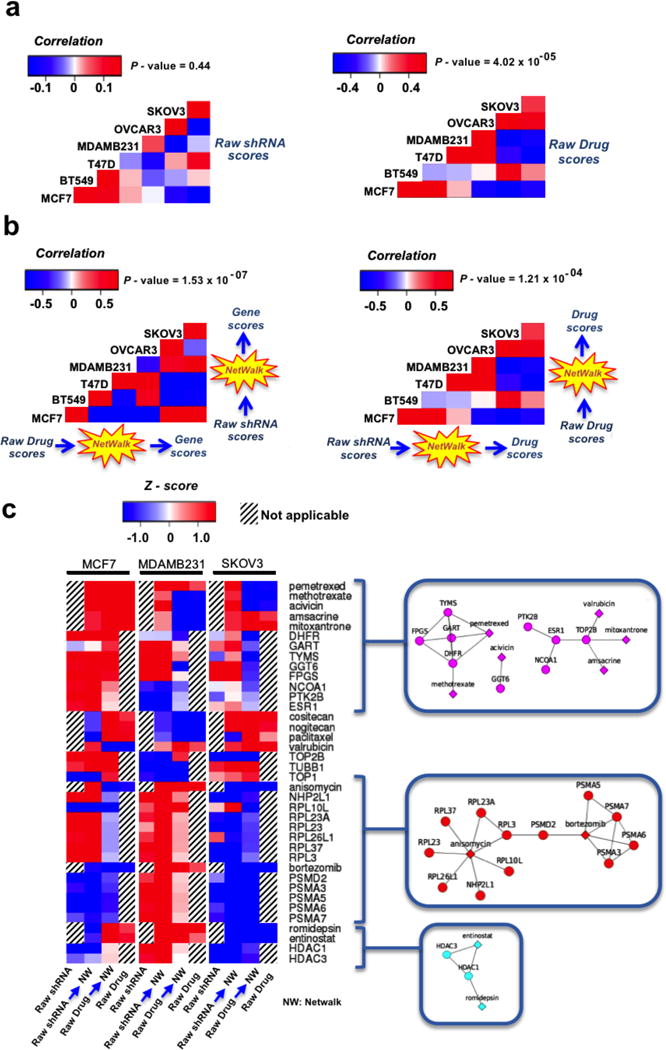
Figure 3.

Correlation analysis of gene-to-drug and drug-to-gene scores from drug and shRNA screens from matching conditions, respectively. a) Correlation analysis by using raw scores. b) Correlation analysis by using NetWalk-based scores. c) Heatmap of drug and gene scores from NetWalk analyses of shRNA and drug screen data from three cancer cell lines and their representative sub-networks.
