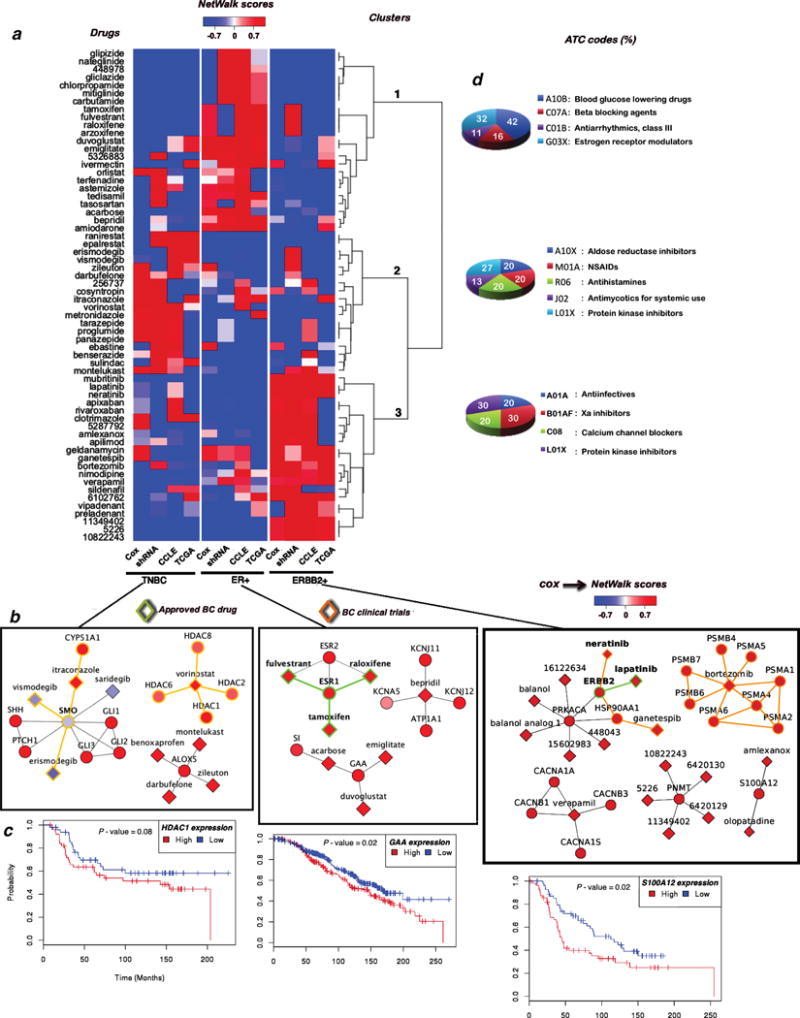
Figure 4.

a) Heatmap of normalized NetWalk-based scores of the survival, lethality and transcriptional profiles for the three breast cancer subtypes. b) Relevant sub-networks for each BC molecular subtype. The clinical status of the drug-target pairs is coded by the edge color. c) Kaplan Meier plots for relevant targets for each BC molecular subtype. d) ATC codes distribution for the prioritized drugs for each BC molecular subtype.
