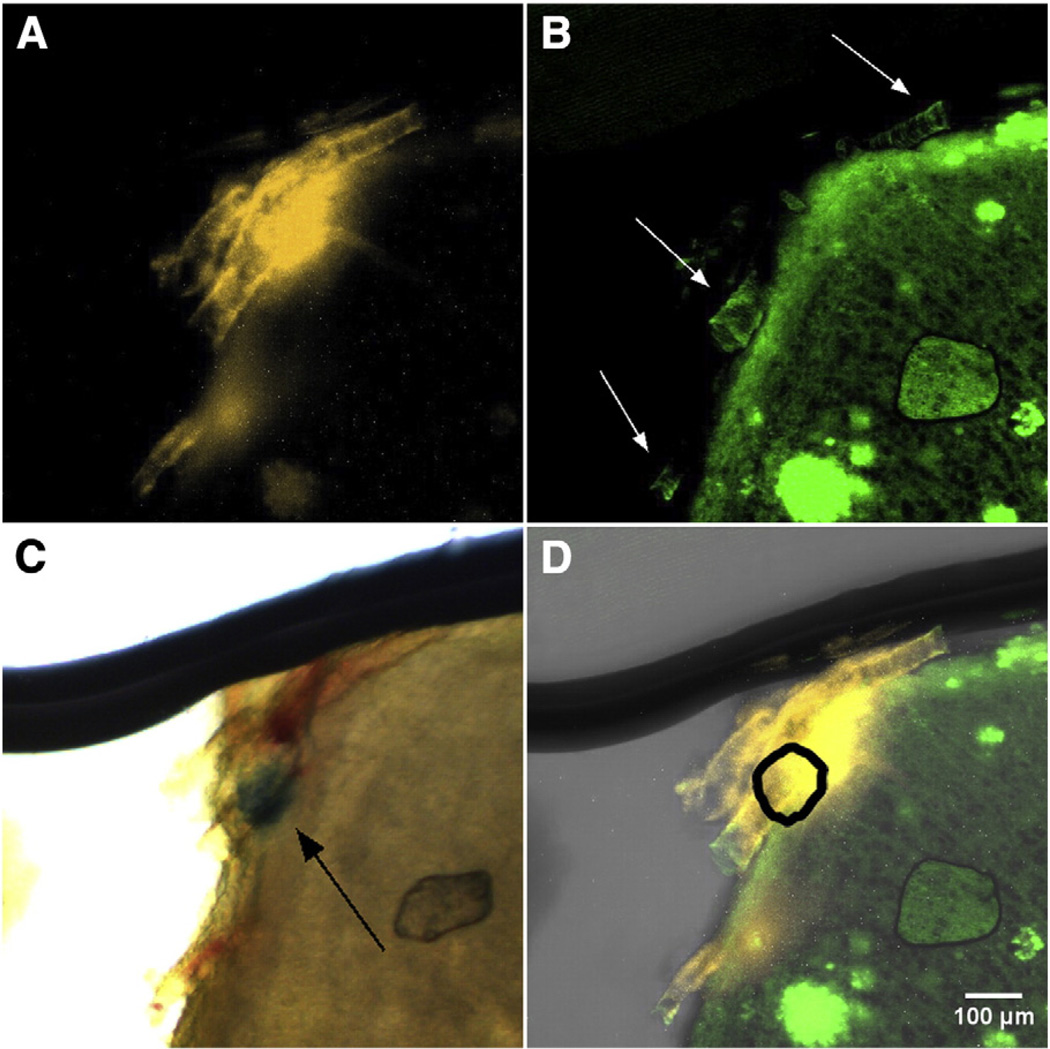
Fig. 3.
(A, B) Representative MIP images of (A) DiI-stained microvasculature and (B) Thioflavin S-stained amyloid deposits from the cerebral cortex of a Tg2576 mouse brain (10× magnification). In (B), regions of vascular amyloid fluorescence (indicated with white arrows) are evidence of CAA pathology. (C) Brightfield microscopy enables visualization of Prussian blue-stained hemosiderin (black arrow). (D) Merged MIP images from (A), (B), and absorption contrast demonstrate co-localization of the vascular amyloid and microbleed. The shape and position of non-fluorescent hemosiderin identified in (C), is shown with the thick black line. A fly-through video (Supplementary Video 1) is provided in the Supplemental materials' section. The thick line at the top of the images is a shadow from the tissue holder used to support the cleared brain section.

