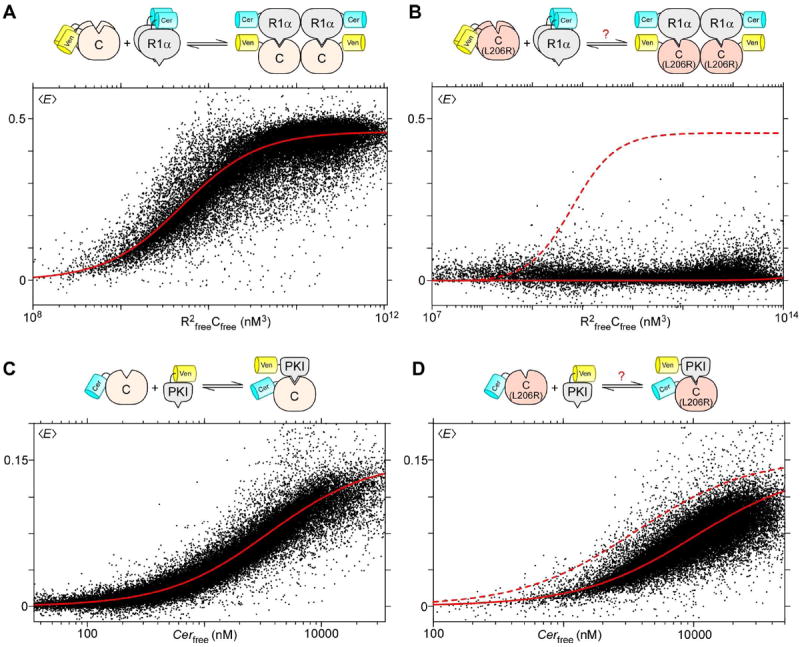
Figure 4. Differential effects on binding by PKAcat L206R.

A. Fluorescent-protein tagged PKAcat and PKAreg fall on a FRET binding curve, with Emax = 0.46 and Kd ≈ 1.7 μM. B. Binding curves between PKAcat (L206R) and PKAreg show complete lack of binding. C. and D. Similarly, these scatter plots show binding curves between PKI and either PKAcat or PKAcat L206R, both of which bind with Emax = 0.16, and Kd = 3.5 and 10 μM respectively.
