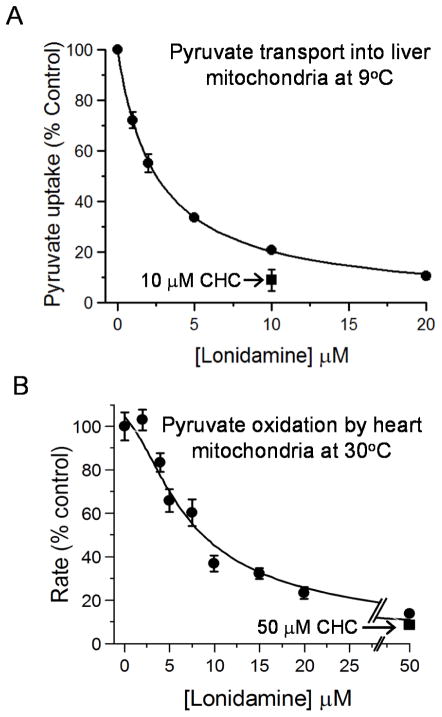
Figure 1. Lonidamine inhibits pyruvate transport into mitochondria.
In Panel A pyruvate transport into liver mitochondria was assayed directly at 9°C using [1-14C]-pyruvate as described under Methods. Data are presented as Means ± S.E.M. for 3 separate mitochondrial preparations. In each experiment, four replicates were performed at each LND concentration and the average value taken to calculate the extent of inhibition as percentage of control (no LND). Data were fitted to the standard inhibition equation (see Methods) to give a derived KI value of 2.5 ± 0.1 μM. The absolute rate of pyruvate (60 μM) uptake in the absence of LND was 0.303 ± 0.032 nmol per mg protein in 45s. Panel B shows data for the inhibition of uncoupled pyruvate oxidation by isolated rat heart mitochondria at 30°C measured using an oxygen electrode as described under Methods. Mean data (± S.E.M.) are presented for 3 separate mitochondrial preparations. The absolute rate of pyruvate oxidation in the absence of LND was 87.9 ± 5.8 nmol O2 · min−1 per mg protein. The data were fitted to an equation that assumes oxidation of pyruvate is set by the activity PDH which in turn is controlled by the rate of pyruvate transport relative to that of PDH as described under Methods. The KI value for LND of 2.5 μM derived from Panel A was employed and the VMAX of PDH and MPC activity (expressed as % control rate of oxygen consumption and ± S.E.) were then calculated by least squares regression analysis to be 127 ± 6.3 and 233 ± 9.1, respectively

