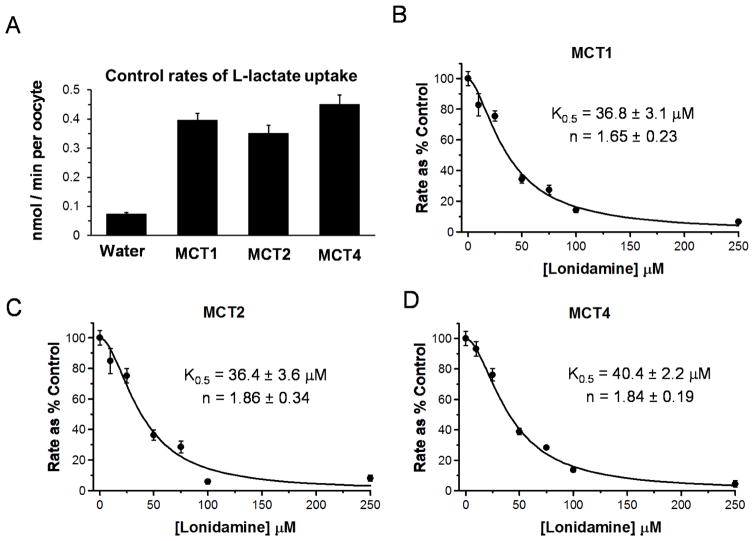
Figure 2. Lonidamine inhibits the proton-linked monocarboxylate carriers MCT1, MCT2 and MCT4.
[U-14C]-L-lactate uptake into Xenopus laevis oocytes expressing the MCT isoform indicated was determined as described in Methods. Panel A shows the absolute rates of L-lactate uptake while Panels B–D show the effects of increasing concentrations of LND on rates of L-lactate uptake into oocytes expressing MCT1, MCT2 or MCT4 as indicated. Rates are expressed as a percentage of the control (no LND) after subtraction of the uptake by water-injected oocytes. Each data point represents mean data ± S.E.M. for 10–45 individual oocytes and data were fitted to the equation for cooperative inhibition using FigSys as described in Methods. The derived values for K0.5 and the Hill Coefficient (n) are indicated on each plot (± S.E. of the fit shown).

