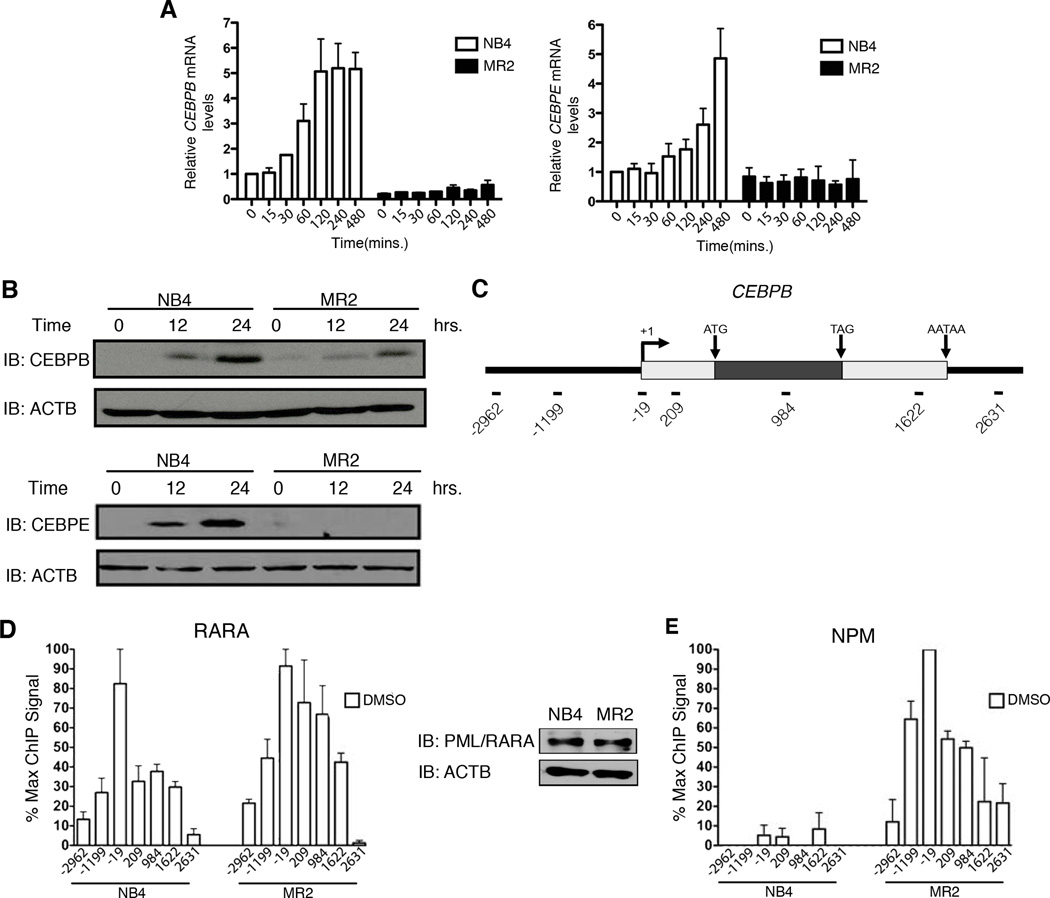
Figure 2. Defective transcriptional activation of RARA target genes upon RA treatment in MR2 correlates with increased NPM at the promoter.
(A) Q-RT-PCR analysis of CEBPB and CEBPE mRNA induction following 8h RA treatment expressed as fold induction over untreated cells after normalization to 18S rRNA levels. Error bars represent the standard error of the mean. (B) Immunoblot analysis demonstrating differential CEBPB and CEBPE protein expression in response to RA treatment (C) Schematic of the CEBPB locus indicating the overall gene structure. Amplicons used in real-time PCR quantification of ChIP-enriched DNA are named according to their relative distance (bps) to the transcription start site. (D) High-density ChIP tiling of RARA at the CEBPB locus under basal conditions in NB4 and MR2 cells and immunoblot analysis of PML/RARA expression levels in the two cell lines. (E) High-density ChIP tiling of NPM at the CEBPB locus under basal conditions in NB4 and MR2 cells.

