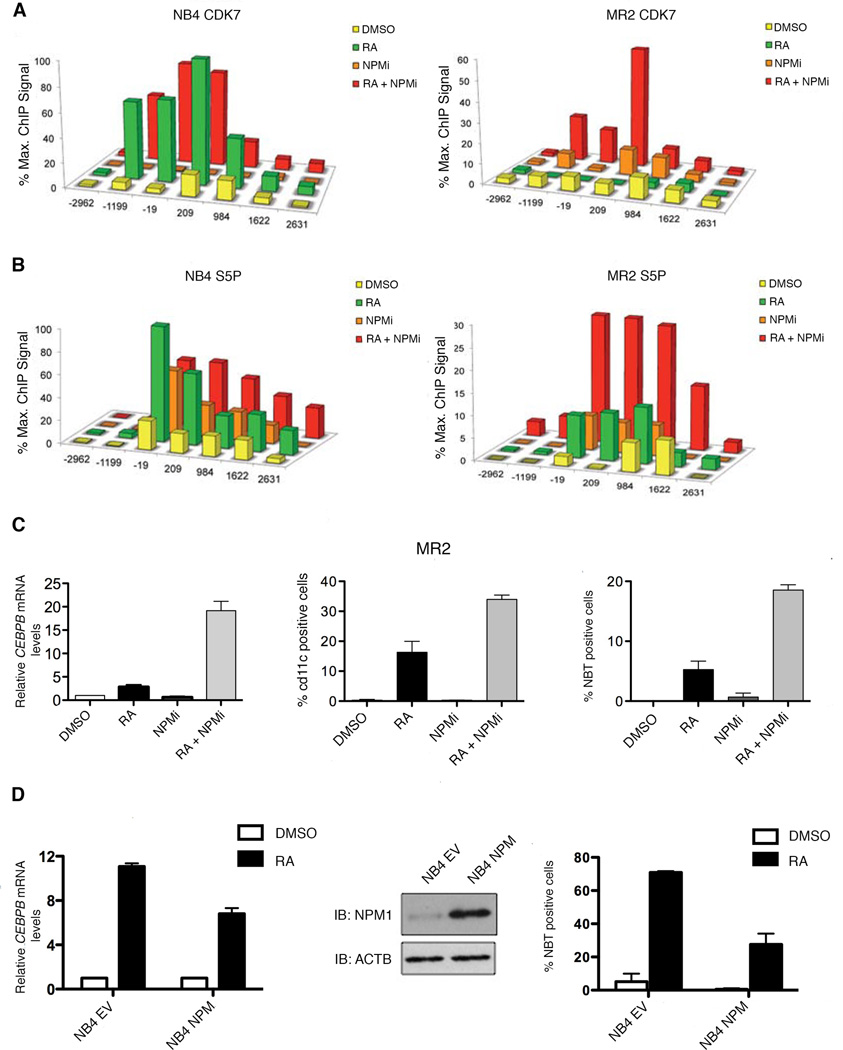
Figure 4. Inhibition of NPM restores myeloid lineage differentiation in resistant cells and overexpression of NPM impairs differentiation in sensitive cells.
(A) ChIP analysis was carried out using protein extracts of DMSO, RA (1h), NPMi (16h) or NPMi and RA-treated (16h + 1h) MR2 and NB4 cells using an antibody recognizing CDK7. (B) ChIP analysis was carried out using protein extracts of DMSO, RA (1h), NPMi (16h) or NPMi and RA-treated (16h + 1h) MR2 and NB4 cells using antibodies against RNAPII S5P. (C) Q-RT-PCR analysis of CEBPB mRNA induction following DMSO, RA, NPMi or RA and NPMi treatment of MR2 cells. Data is expressed as fold induction over DMSO treated cells and normalized to 18S ribosomal RNA levels. Error bars represent the standard error (left panel). Percentages of MR2 cells expressing the differentiation marker cd11c in response to 3-day exposure to RA, NPMi, or a combination of both (middle panel). Results ofNBT reduction assay performed on MR2 cells treated with RA, NPMi, or the combination for 5 days (right panel). (D) NB4 cells were stably transfected with empty vector (NB4 EV) or the NPM expression plasmid (NB4 NPM). Overexpression of NPM was verified by separating total nuclear proteins via SDS-PAGE and followed by Western blotting using NPM antibody (middle panel). Quantitative real-time PCR analysis of CEBPB mRNA induction following 8h RA treatment expressed as fold induction over DMSO treated cells after normalization to 18S rRNA levels. Error bars represent the standard error of the mean (left panel). NBT reduction results in response to 5-day exposure to RA. Results are representative of three experiments performed in triplicate. Error bars represent standard error of the mean (right panel).

