Fig. 3.

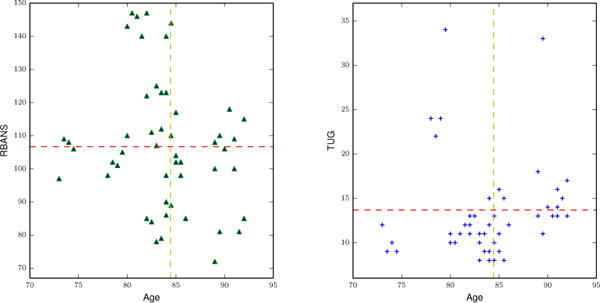
Distribution of RBANS (left) and TUG (right) clinical assessment scores in the y-axis with respect to age in x-axis. The horizontal line represents a mean clinical score and the vertical line represents the mean age.

Distribution of RBANS (left) and TUG (right) clinical assessment scores in the y-axis with respect to age in x-axis. The horizontal line represents a mean clinical score and the vertical line represents the mean age.