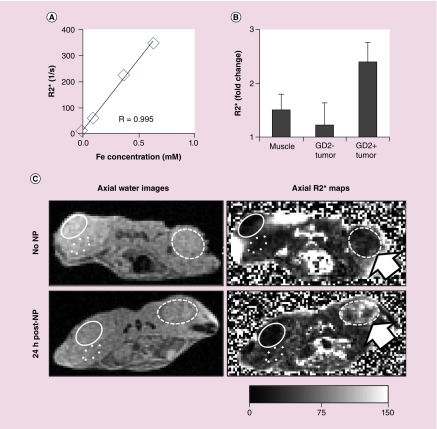
Figure 7. . Iron oxide nanoparticles in GD2+ xenografts are detectable by magnetic resonance.
(A) Correlation between MR R2* values iron concentration for BNF nanoparticle phantoms (linear regression, coefficient R = 0.995). (B) R2* fold change in GD2+ tumors, GD2– tumors and muscle in mice 24 h after anti-GD2-BNF injection versus mice with no treatment. Averages ± standard deviation, n = 2. (C) MR images (method parameters B) of a noninjected mouse (upper panels) and a mouse 24 h after intravenous anti-GD2-BNF NP administration shows elevated R2* for the injected mouse in the GD2+ tumor (arrow). Region of interest defined on water images (left panels) and corresponding R2* images (right panels) circumscribe GD2+ xenografts (CHLA-20, dashed line), GD2– xenografts (PC-3, solid line) and control skeletal muscle (dotted). Representative images of two experiments with two separate anti-GD2-BNF batches.
BNF: Bionized NanoFerrite; NP: Nanoparticle.

