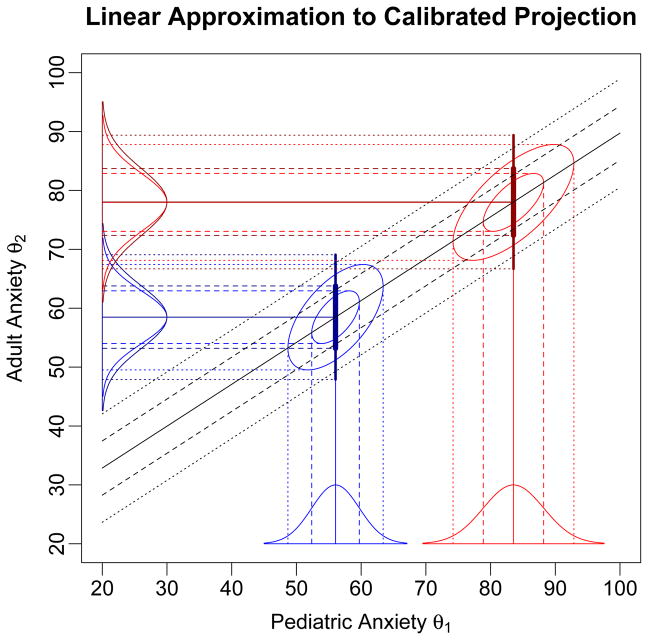
Figure 1.
The x-axis variable is θ1, the underlying construct measured by the first scale and the y-axis variable is θ2, the underlying construct measured by the second scale; the illustration is for the PROMIS pediatric and adult Anxiety scales. Both scales report scores in T-score units. The IRT model distributions on θ1 for two response patterns on the pediatric Anxiety scale are shown along the x-axis, along with the corresponding bivariate distributions, and those implied by calibrated projection on θ2. The darker blue and red lines and curves on the θ2 axis show the normal approximations to the projected posterior distributions computing using the linear approximation, based on the regression (solid black) line, and the combination of the variances of the θ1 distributions and the variance around the regression line.

