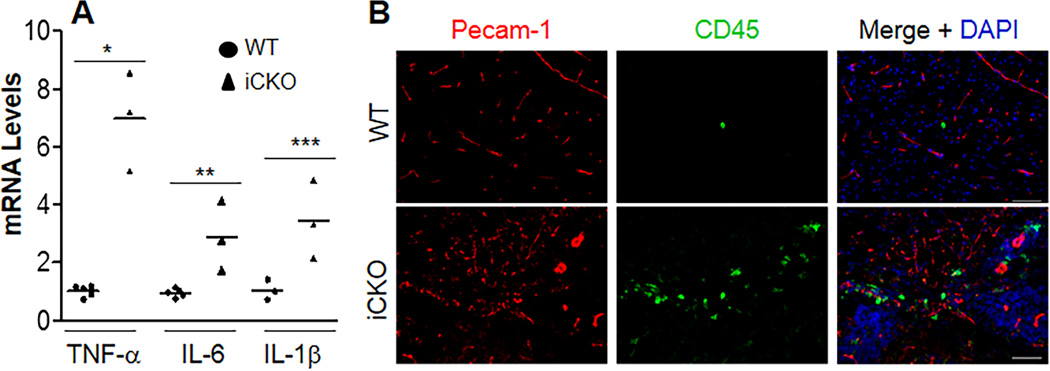
Figure 4. iCKO mice exhibited prominent CNS inflammation.
(A) Quantitative RT-PCR analysis demonstrating increased expression of pro-inflammatory cytokines in brain tissues of iCKO mice with seizure. Brain tissues were collected from WT and iCKO mice with seizure. Data are expressed as mean ± SD (n=4–5/group). *, P = 0.0002; **, P = 0.009; ***, P = 0.041 (2-tailed t test). Bars represent mean. (B) Marked leukocyte infiltration in brain parenchyma of the seizing iCKO mice. Brain sections were co-immunostained for Pecam-1 (EC marker, red) and CD45 (pan-leukocyte marker, green). Scale bars, 50µm.

