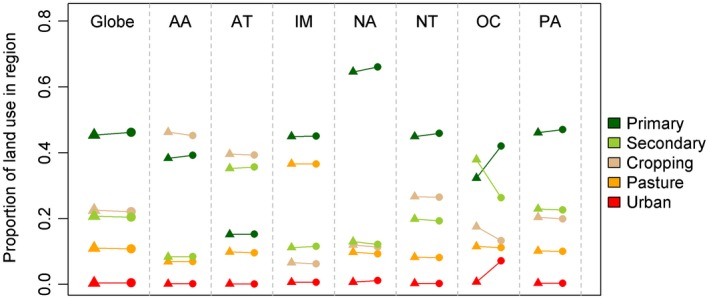
Figure 5.

Comparison of the aggregated proportions of each of five different land‐use classes from both the Land‐use Harmonization dataset (triangles) and the results of the downscaling procedure (circles) aggregated globally and for each realm. AA: Australasia, AT: Afrotropics, IM: Indo‐Malaysia, NA: Nearctic, OC: Oceania, PA: Palearctic.
