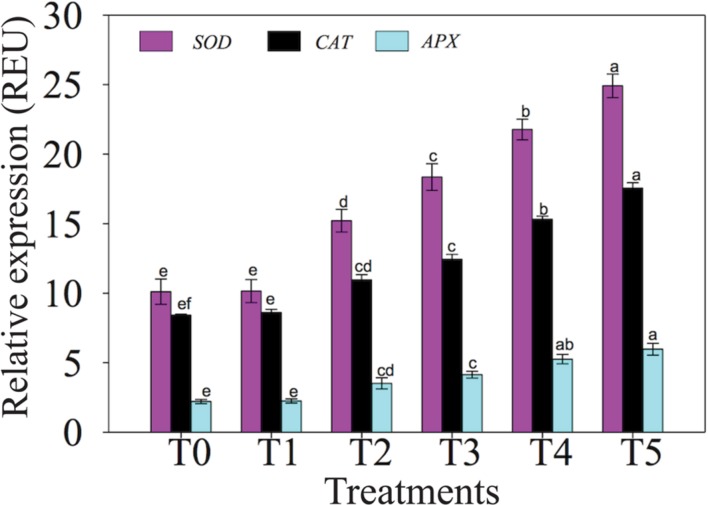
FIGURE 4.
Effects of NO on expression levels of selected SOD, CAT and APX genes in leaves of chickpea plants under salt stress. Data presented are the means ± SEs (n = 5). Different letters indicate significant difference (P ≤ 0.05) among the treatments. T0 (control) = 0 mM NaCl + 0 μM SNAP; T1 = 0 mM NaCl + 50 μM SNAP; T2 = 50 mM NaCl + 0 μM SNAP; T3 = 50 mM NaCl + 50 μM SNAP; T4 = 100 mM NaCl + 0 μM SNAP; T5 = 100 mM NaCl + 50 μM SNAP. REU, relative expression unit.

