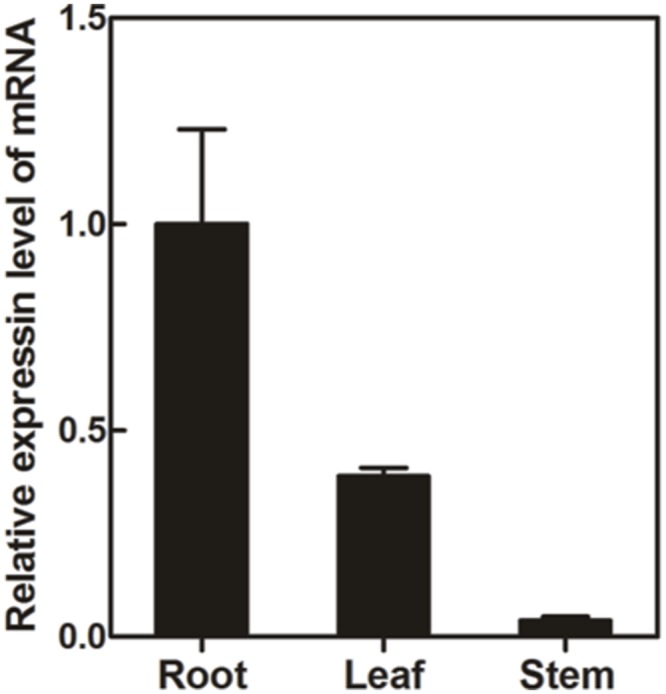
FIGURE 5.

Quantitative real-time reverse transcription PCR (qRT-PCR) analysis of the PlUGT2 trancript abundance in different organs of P. lobata. The transcript abundance of PlUGT2 in different organs were normalized to the actin (internal reference) and expressed relative to the values of roots (control), which was set the value of 1. The data were derived from three biological replicates. The primer sequences used for qRT-PCR analysis are shown in Supplementary Table S2.
