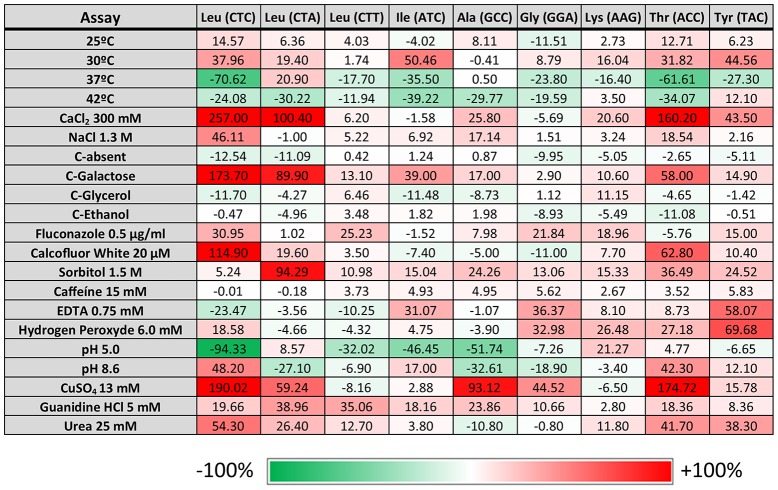
Figure 2.
Phenotypic assays. Data represent the average size of the colonies obtained for all the transformed cells after 5 days of growth under the indicated conditions normalized with growth at 30°C and compared with the normalized control pUA552 (considered 0%) for that condition (relative growth score). The assay was performed with two independent growth cultures and three independent clones. Brick color intensity represents the strength of the phenotype. White squares represent a phenotype that is indistinguishable from the control strain pUA552. Green and red squares represent either a growth reduction or enhancement, respectively.

