Figure 4.

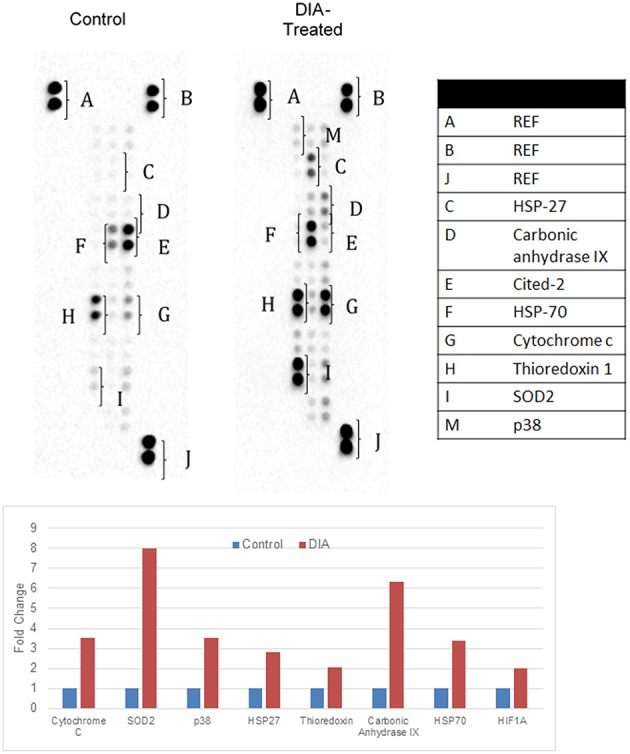
Representative image of the proteome profiler analysis for cell stress-related images as well as the quantification values for HeLa cells; both control (untreated) and DIA-treated cells (15 ug/mL) for 48 h.

Representative image of the proteome profiler analysis for cell stress-related images as well as the quantification values for HeLa cells; both control (untreated) and DIA-treated cells (15 ug/mL) for 48 h.