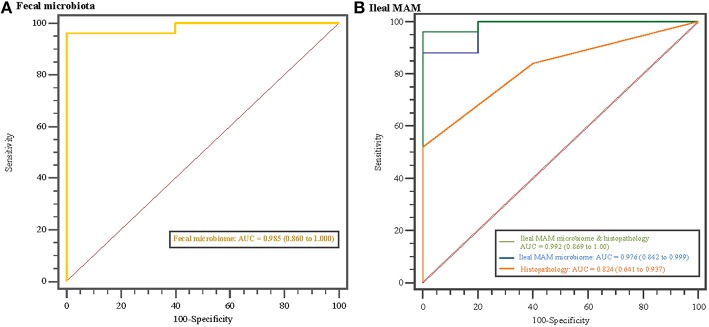
Figure 5.
Disease classification based on microbiome profile and histopathology scores. Receiver operating characteristics (ROC) curves and area under the curve (AUC) values with 95% confidence intervals in parentheses comparing MAP-infected and control animals based on (A) fecal microbiota profile, and (B) ileal mucosa-associated microbiota (MAM) profile, histopathology scores, and combination of ileal MAM profile and histopathology scores. The straight line represents the null model.

