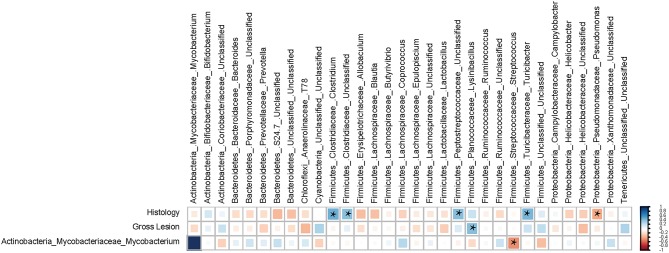
Figure 6.
Spearman's correlation coefficient analysis. The correlation matrix was based on the relationship of the abundant ileal mucosa-associated bacterial genera (>0.1% of community) with the severity of macroscopic and histological lesions. The strength of the correlation between each pair of variables is indicated by the size and color intensity of the squares. A color code of dark blue indicates a positive correlation coefficient close to +1, whereas dark red indicates a negative correlation coefficient close to –1. All pairwise correlations with a P < 0.05 were considered significant and indicated by “*”. The last row of the matrix was included to explore the correlation between the proportion of genus Mycobacterium and other abundant members of the mucosa-associated microbiota (MAM).

