Figure 5.

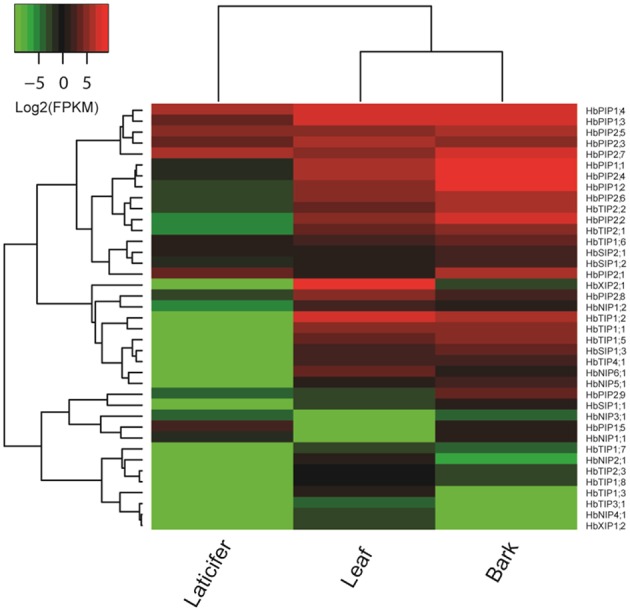
Expression profiles of the 39 HbAQP genes in laticifers, barks and leaves. Color scale represents FPKM normalized log2 transformed counts where green indicates low expression and red indicates high expression.

Expression profiles of the 39 HbAQP genes in laticifers, barks and leaves. Color scale represents FPKM normalized log2 transformed counts where green indicates low expression and red indicates high expression.