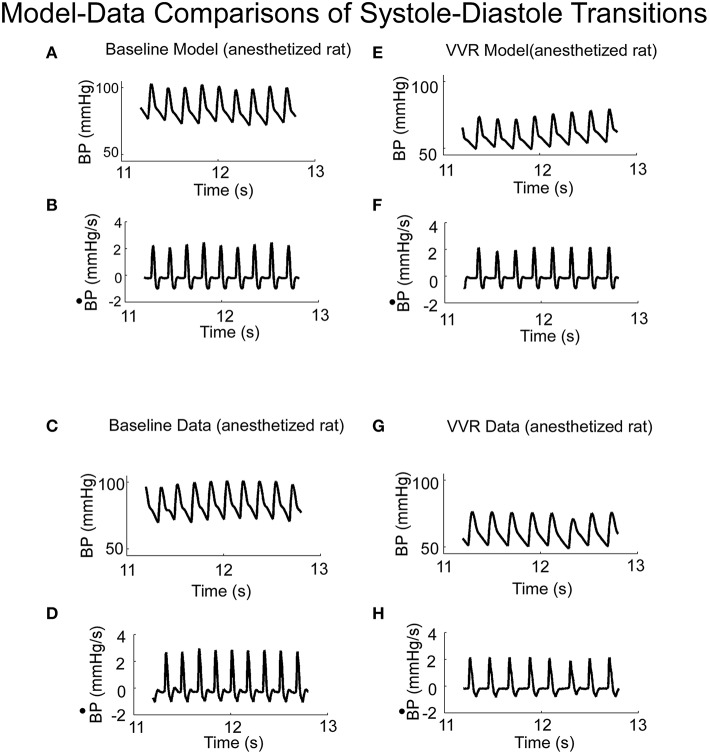
Figure 4.
(A) Model predictions of systoles and diastoles during baseline BP. (B) Model predictions of the derivative of BP (). (C,D) Corresponding baseline experimental data of BP and its derivative, , measured in anesthetized rat. Model predictions of systoles and diastoles of BP (E), and its derivative, (F), during a VVR. Note that with the NL function, the model predicted the average BP, systoles and diastoles acurately. (G,H) Corresponding baseline experimental data of BP and its derivative, , measured in an anesthetized rat.

