
Figure 7.
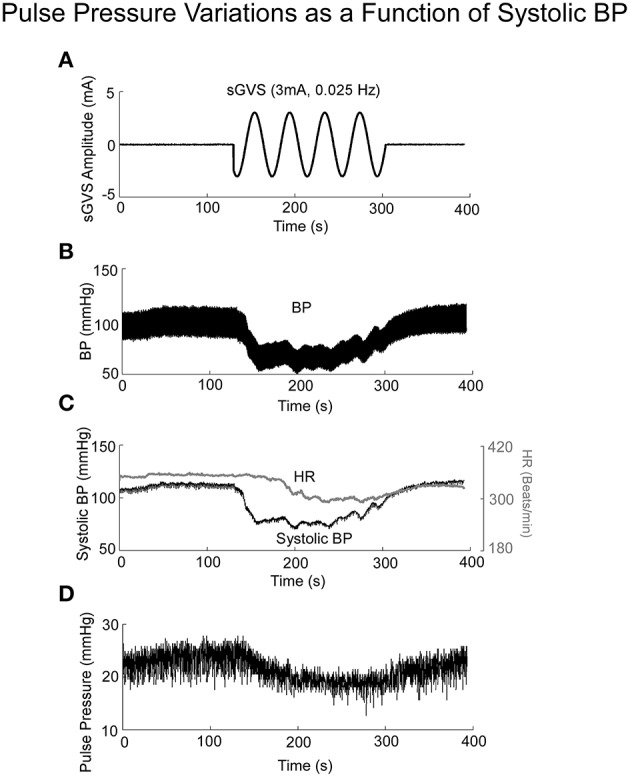
BP, HR, and Pulse Pressure in response to 3 mA, 0.025 Hz sGVS. (A) sGVS stimulus. (B) BP response showing a VVR and oscillations in response to sGVS. (C) Systolic BP as a function of time, before, during, and after sGVS. BP transiently fell, was sustained during stimulation and then rose back to steady state level. HR also fell, but not synchronously with BP. (D) Pulse pressure averaged over 25 s interval rose and fell in synchrony with BP.