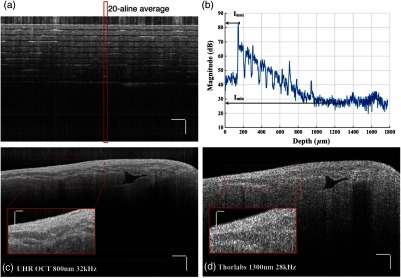
Fig. 7.
(a) A single B-scan of a stack of tapes. Averaged A-line across 20 lateral pixels (red box) is shown in (b). The signal strength at the top layer of the tape stack and the background below the bottom layer was used for contrast calculation. (c) and (d) Contrast comparison between the B-scan images of the swine heart right ventricular septum acquired from (c) the UHR OCT system at 32 kHz line rate and (d) Thorlabs Telesto system at 28 kHz line rate, respectively. Four consecutive B-scans were averaged to show a clear image. Scale bar: . Inset scale bar: .

