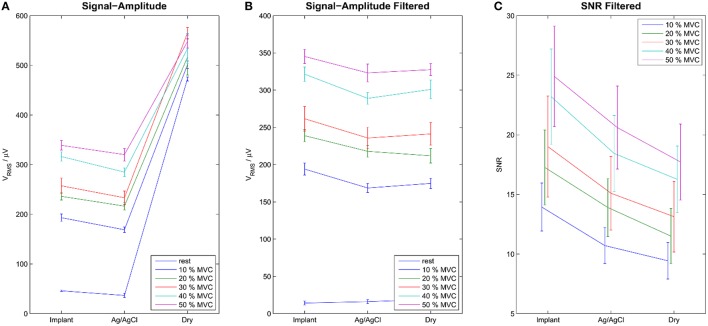
Figure 6.
Signal Amplitudes of the raw (A) and the filtered (B) signals during rest and contraction of various levels. Error-bars show inter-trial standard deviation. SNR is shown only for the filtered signals (C). Without filtering the noise level was very high, exceeding the level of EMG signal for dry electrodes. After temporal filtering and common mean subtraction, the difference between the electrode types was less pronounced. The Implants showed the best SNRs, followed by the gelled Ag/AgCl and the dry electrodes.

