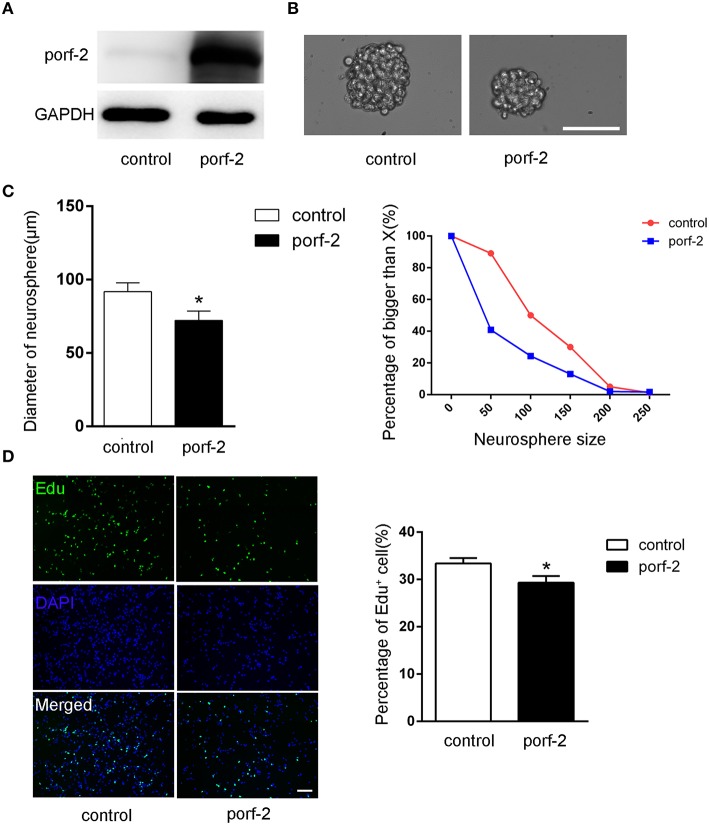
Figure 3.
Porf-2 inhibits NSC proliferation in vitro. (A) Confirming the overexpression of porf-2 protein by immunoblot. (B) The neurosphere morphology in control and porf-2 overexpression group. Scale bar: 50 μm. (C) Quantification of the diameter of neurosphere in each group. Data are mean ± SEM (n = 3). (D) Representative image of Edu positive cells in each group. The total NSC number was counted by DAPI. Quantification of the percentage of Edu positive cell number in each group. Scale bar: 100 μm. Data are mean ± SEM (n = 4). *P < 0.05.

