Figure 5.
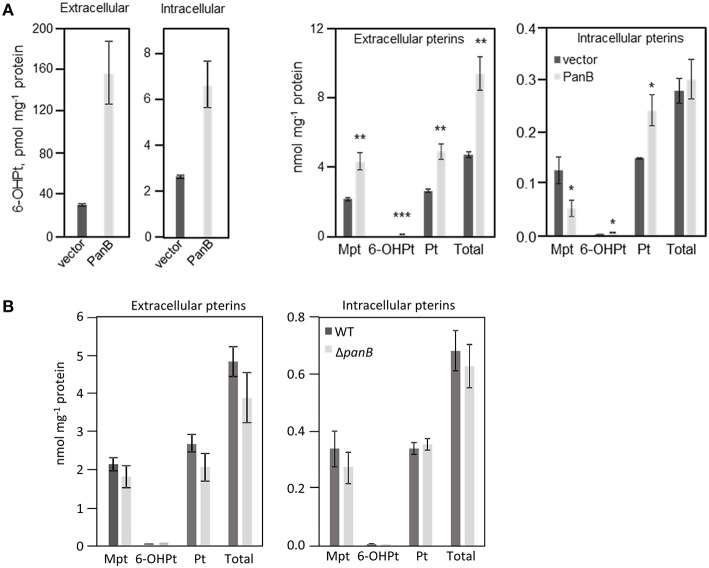
Quantification of pterin pools in E. coli cells over- or underexpressing PanB. (A) Quantitation of intra- and extracellular pterins extracted from E. coli wild type MG1665 harboring pUC19 (vector) or overexpressing panB (PanB). Strains were grown in liquid M9 medium plus 0.4% glucose to an A600 of 1.0. Cultures were induced by the addition of 0.5 mM IPTG at an A600 of 0.3. Cell extracts and media were oxidized before analysis by HPLC to convert di- and tetrahydropterins to their fluorescent aromatic forms. Pterin contents of both extacts and media are expressed per unit of protein in the cells from which they came. Data are means and standard errors from three biological replicates, and were subjected to a t-test. Differences in pterin content between vector control and the panB overexpressing strains that are significant at P < 0.05, < 0.01, or < 0.001 are respectively marked by one, two, or three asterisks. Mpt, monapterin; Pt, pterin; 6-OHPt, 6-hydroxymethylpterin. Note the 1000-fold difference in scale between the two frames on the left (which report only 6-hydroxymethylpterin levels) and the two frames on the right (which report the levels of all pterins measured). (B) Quantification of intra- and extracellular pterins extracted from E. coli wild type BW25113 and ΔpanB::kan mutant. Strains were grown in liquid M9 medium plus 0.4% glucose and 10 μM pantothenate to an A600 of 1.0. Samples were treated and analyzed as in (A).

