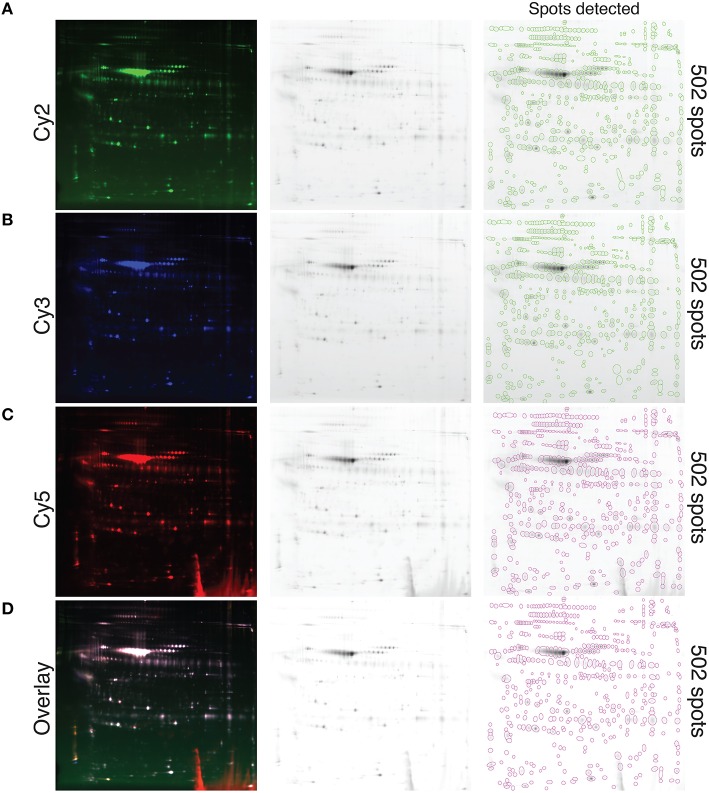
Figure 3.
Visualization of whole secreted protein and quantification of the protein spots resolved with 2D-DIGE at the optimal induction condition. Conjugation of each CyDye, Cy2 (A), Cy3 (B), and Cy5 (C), to precipitated proteins extracted from fibroblast conditioned-medium via the TCA-DOC method and resolved by 2D-DIGE is shown. Please note that all technical replicates (disease and control) obtained for the 48 h post-confluence induction condition were pooled together prior CyDye conjugation and loaded on gel. (D) Represents a fusion image of the three different CyDyes. Each individual spot is circled. The number of detected spots (502) is indicated at the far right. Equal number of spots is detected for each of the tested CyDyes indicating that each of the specific tested CyDyes bond with the same effectiveness and therefore that the conjugation efficiency is independent of the CyDye fluors.

