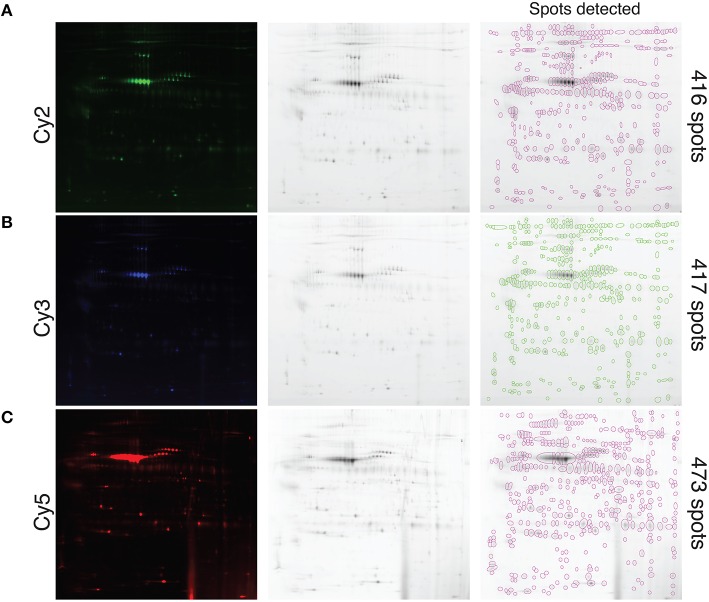
Figure 4.
Visualization and quantification of the protein spots of different tested induction conditions and precipitation methods. Proteins were conjugated with the different CyDyes after extraction with the TCA-DOC, 24 h, post-confluence (Cy2) (A), TCA-NLS-THF, 48 h, post-confluence (Cy3) (B) and TCA-DOC, 48 h post-confluence (Cy5) (C) induction conditions and precipitation methods and resolved by 2D-DIGE from one control cell line. Each individual spot is circled and was automatically quantified by the software (far right). Note that the TCA-DOC 48 h post-confluence induction condition, which was also consistently given better protein recovery yield, gave the highest number of protein spots.

