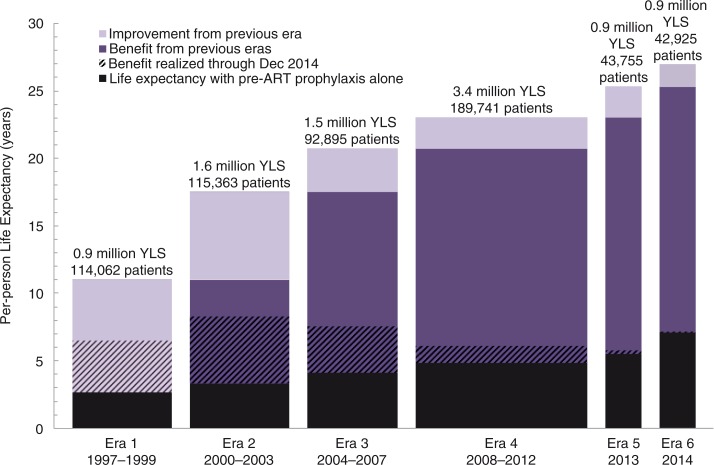
Figure 1.
Years of life saved per-person in each era produced by model simulations.
Bar width corresponds to the number of patients in each era and total coloured area corresponds to lifetime survival benefits. Survival benefits realized as of December 2014 are shaded with diagonal lines. YLS: years of life saved; ART: antiretroviral therapy.

