Figure 1.

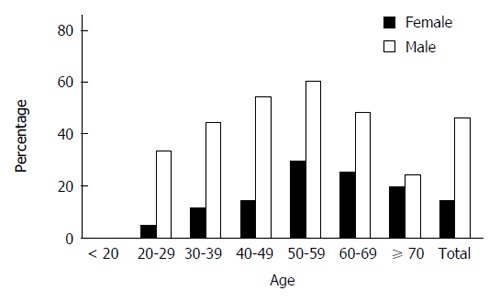
Age and sex distribution of overall non-alcoholic fatty liver disease prevalence. The overall non-alcoholic fatty liver disease prevalence is presented by the distribution according to age and sex.

Age and sex distribution of overall non-alcoholic fatty liver disease prevalence. The overall non-alcoholic fatty liver disease prevalence is presented by the distribution according to age and sex.