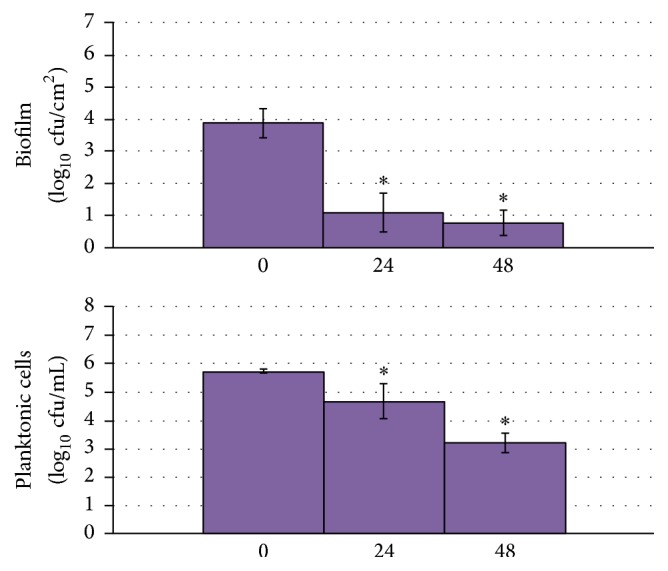
Figure 3.

Results of quantitative cultures of Candida albicans biofilms on Teflon discs and associated planktonic cells with 500 µA DC exposure started at the time of candidal seeding of the discs. The x-axis shows hours of DC exposure. The y-axis shows results of quantitative cultures in log10/cm2 for biofilm and log10/mL for planktonic cultures. The 0 µA controls that were tested at each time point were combined for graphical purposes. ∗Statistical significance compared to exposure to no current (p < 0.05).
