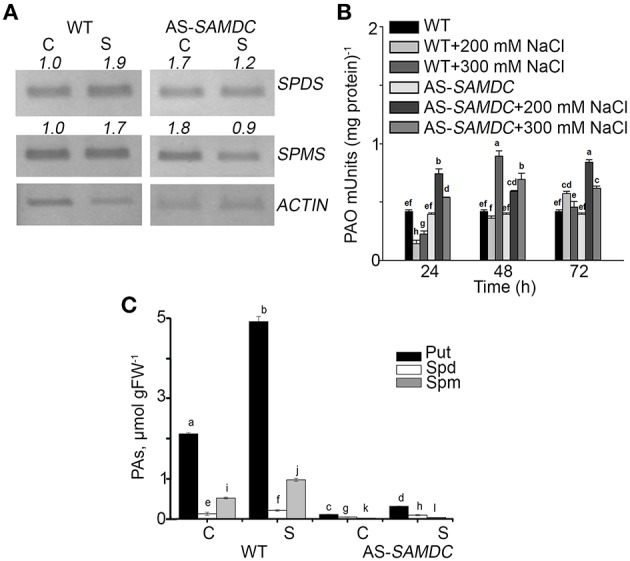
Figure 2.

Polyamine homeostasis in WT and AS-SAMDC plants under control and NaCl treatment. (A) Semi-quantitative RT-PCR analysis of SPMS and SPDS in control (C) or 100 mM NaCl (S) conditions. Numbers indicate pixel intensity of corresponding bands normalized according to ACTIN. (B) PAO activity in control and 24, 48, and 72 h post-treatment with 200 or 300 mM NaCl. Data are means ± SE of three biological replicates with three technical replicates each. (C) PA levels in WT and AS-SAMDC plants in control (C) or 200 mM NaCl (S). Data are means ± SE of three biological replicates and different letters indicate significant difference (Student's t-test, P < 0.05).
