Figure 3.
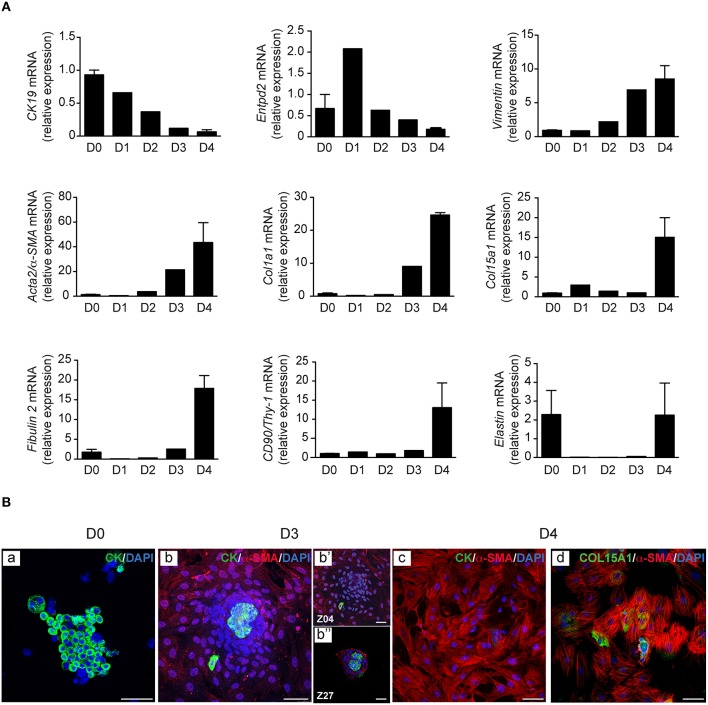
Time course of cell markers in PMF culture. PMF culture was subjected at different time points, to (A) RT-PCR analysis of cytokeratin 19 (CK19), ecto-nucleoside triphosphate diphosphohydrolase 2 (Entpd2), Vimentin, Acta2/α-SMA, Col1a1, Col15a1, Fibulin 2, and CD90/Thy-1; mRNA levels are normalized for Hprt and reported relative to those measured immediately after bile duct isolation (D0). They represent the means ± standard error of 2–3 preparations. (B) Immunofluorescence of cytokeratin (CK), and of α-SMA co-labeled with CK or COL15A1; nuclei were stained with DAPI; z images at 5.7 (Z04) and 13.6 (Z27) μm from the substrate are shown. D, days; Scale bars, 50 μm.

