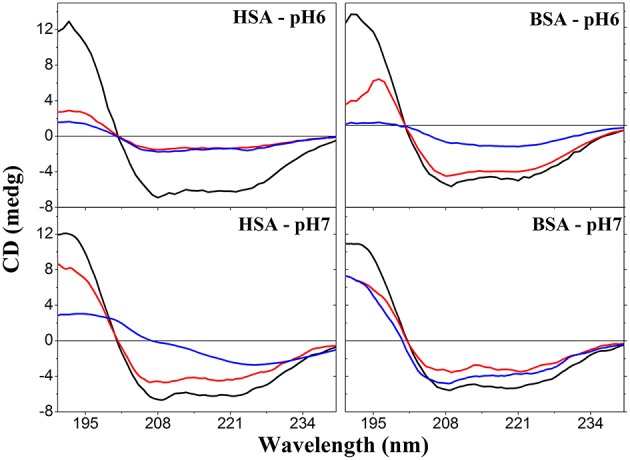
Figure 3.

Far-UV CD spectra of native, NEM-treated and heat-denaturated HSA and BSA. Upper and lower panels show, respectively, the spectra obtained at pH 6 and 7. For each panel, the black, blue and red lines represent, respectively, the spectra of native, heat-denatured, and NEM-treated albumins.
