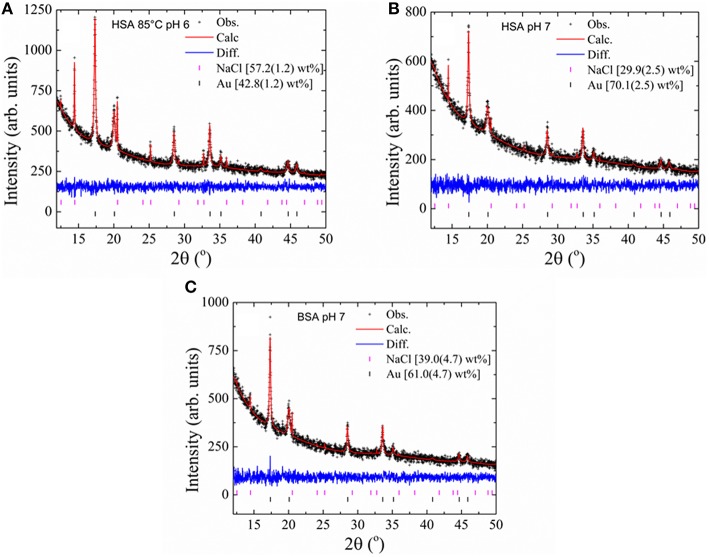
Figure 5.
XRD pattern of GNPs obtained using different forms of albumins. The data were obtained from the final Rietveld refinement for GNPs obtained with heated HSA at pH 6 (A), native HSA and BSA at pH 7 (B and C, respectively). Black crosses represent observed data; the continuous red line indicates the calculated pattern and the blue line represents the difference between the observed and calculated patterns. Black and magenta vertical bars at the bottom indicate Bragg reflections for the Au and NaCl phase, respectively.

